PyCurious: A Python module for computing the Curie depth from the magnetic anomaly
Multiple geophysical methods have been proposed to resolve the thermal structure of the Earth’s lithosphere with varying degrees of precision. Geotherms may be constructed from heat flow or xenolith data, but the spatial coverage of these are often limited. Seismic velocity has proven effective to infer upper-mantle temperature, but its application relies on building a compositional model suitable for the geological context and estimating attenuation from grainsize and water content. In contrast, magnetic data are among the most widespread geophysical datasets available on the surface of the Earth and can offer useful insight into its thermal structure.
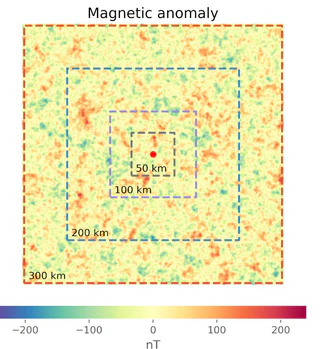
The magnetic anomaly is the observed magnetic field less the contribution from the core and external fields. Geologic features enhance or depress the local magnetic field; this response is primarily controlled by the concentration of magnetite in the Earth’s crust. Magnetite is the most prevalent magnetic mineral, in terms of both its magnetic susceptibility and concentration in the crust, and has a Curie point of 580°C. The depth at which rocks lose their permanent magnetic properties is referred to as the Curie depth. Due to the prevalence of magnetite in the crust, the Curie depth is often interpreted as the 580°C isotherm. Current methods to derive the Curie depth first compute the (fast) Fourier transform over a square window of a magnetic anomaly that has been reduced to the pole. The depth and thickness of magnetic sources is estimated from the slope of the radial power spectrum.
Our Python package, pycurious, ingests a map of the Earth’s magnetic anomaly and distributes the computation of Curie depth across multiple CPUs.
pycurious implements the Tanaka et al. (1999) and Bouligand et al. (2009) methods for computing the thickness of a buried magnetic source.
The former selects portions of the radial power spectrum in the low and high frequency domain to compute the depth of magnetic sources, while the latter fits an analytical solution to the entire power spectrum.
We cast the Bouligand et al. (2009) method within a Bayesian framework to estimate the uncertainty of Curie depth calculations (Mather & Fullea, 2009).
Common computational workflows and geospatial manipulation of magnetic data are covered in the Jupyter notebooks bundled with this package.
The mapping module includes a set of functions that help to wrangle maps of the magnetic anomaly into a useful form for pycurious.
Such an approach is commonly encountered for transforming global compilations of the magnetic anomaly, e.g., EMAG2 (Meyer et al., 2017), from latitudinal/longitudinal coordinates to a local projection in eastings/northings.
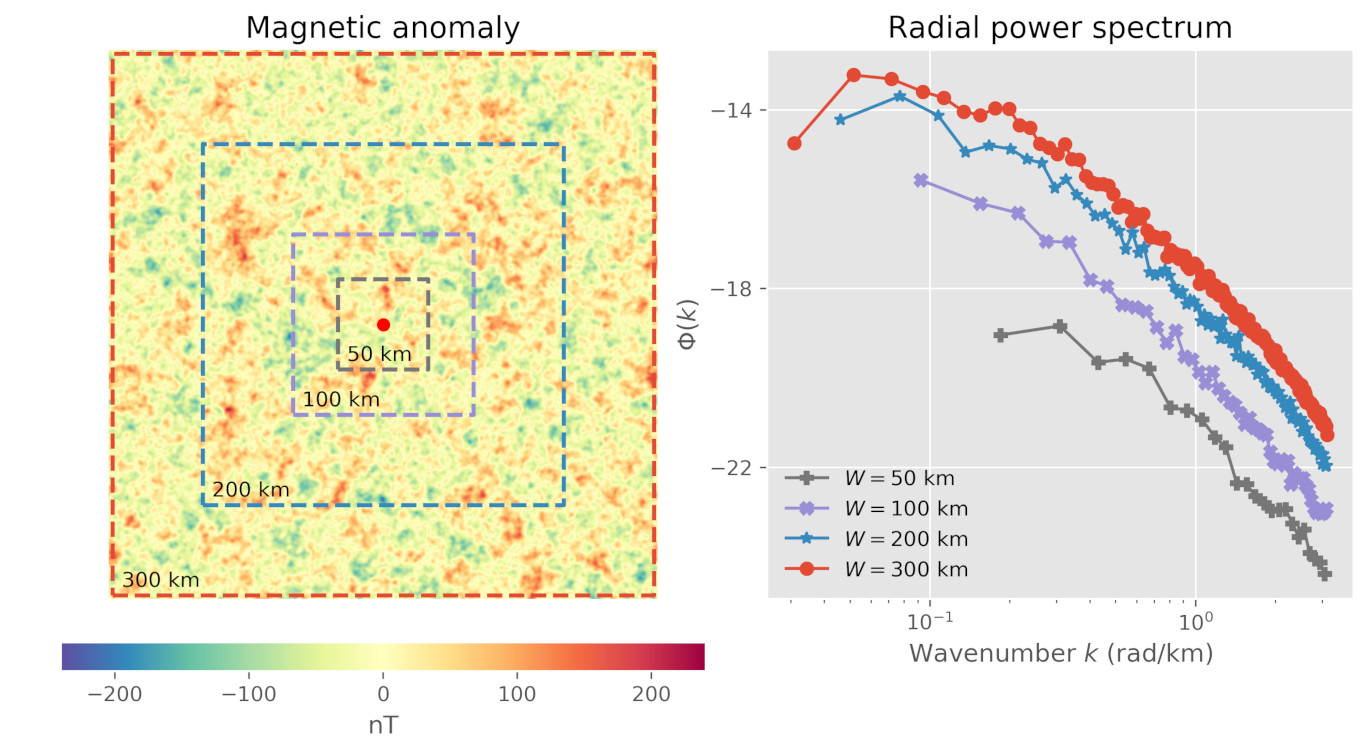
pycurious. Larger window sizes increase the number of points in the low wavenumber range of the radial power spectrum, which is important for estimating the thickness of magnetic sources in the crust.pycurious includes the following functionality:
- Importing and exporting GeoTiff files.
- Converting between geospatial coordinate reference systems (CRS).
- Decomposition of magnetic grids into square windows over which to compute Curie depth.
- Parallel distribution of computation across computing resources.
- Bayesian inversion framework and sensitivity analysis.
Documentation and examples
pycurious is bundled with a linked collection of Jupyter notebooks that can act as a user guide and an introduction to the package.
The notebooks are split into matching sets for frequentist and Bayesian estimates of Curie depth.
The notebooks cover:
- Plotting the radial and azimuthal power spectrum.
- Computing Curie depth from a synthetic magnetic anomaly.
- Exploring parameter sensitivity.
- Posing the inverse problem and objective function.
- Mapping Curie depth using the EMAG2 magnetic anomaly dataset (Meyer et al., 2017).
All documentation can be accessed from within the module via a Python function that installs the notebooks at a filesystem location specified by the user at run time.
The API documentation is kept up-to-date on GitHub pages.
pycurious and all Python dependencies can be installed through the pypi.org pip package manager, however, several of the dependencies for cartopy may cause problems for inexperienced users.
We therefore provide a Docker image built with all required and optional dependencies and a deployment of the documentation / examples on mybinder.org.
Acknowledgements
This work was made possible by the G.O.THERM.3D project, supported by an Irish Research Council Research for Policy & Society grant (RfPS/2016/50) co-funded by Geological Survey Ireland and by Sustainable Energy Authority Of Ireland.
Development of pycurious was inspired from pycpd and fatiando a terra.
References
Bouligand, C., Glen, J. M. G., & Blakely, R. J. (2009). Mapping Curie temperature depth in the western United States with a fractal model for crustal magnetization. Journal of Geophysical Research, 114(B11104), 1–25. doi:10.1029/2009JB006494
Mather, B., & Fullea, J. (2019). Constraining the geotherm beneath the British Isles from Bayesian inversion of Curie depth: integrated modelling of magnetic, geothermal, and seismic data. Solid Earth, 10(3), 839–850. doi:10.5194/se-10-839-2019
Meyer, B., Saltus, R., & Chulliat, A. (2017). EMAG2: Earth Magnetic Anomaly Grid (2-arc-minute resolution) Version 3. National Centers for Environmental Information, NOAA. doi:10.7289/V5H70CVX
Tanaka, A., Okubo, Y., & Matsubayashi, O. (1999). Curie point depth based on spectrum analysis of the magnetic anomaly data in East and Southeast Asia. Tectonophysics, 306(3-4), 461–470. doi:10.1016/S0040-1951(99)00072-4

I am an ARC Industry Research Fellow in the School of Geography, Earth and Atmospheric Sciences at The University of Melbourne. I am an expert in fusing Earth evolution models with data to understand how groundwater moves critical minerals through the landscape. Related research interests include the cycling of volatiles within the Earth, probabilistic thermal models of the lithosphere to unravel past tectonic and climatic events, and understanding the how enigmatic volcanoes form.
I am a vocal advocate for the integral role of geoscience in responding to challenges we face in transitioning to the carbon-neutral economy. As an expert in my field, I have been interviewed in national and international print media, TV, and radio on a wide variety of subjects including earthquakes, volcanoes, groundwater, and critical minerals.